Share the post "Cycling trips: + 45% in Paris according to Strava Metro"
Strava, the world’s largest sports community with over 93 million athletes, is today releasing some of its Strava Metro data. This is the world’s largest dataset on active transport, and an indispensable decision-making tool for the implementation of cycling and pedestrian infrastructure. By offering cities free access to aggregated and anonymized information on active mobility, Strava Metro enables more informed urban planning decisions for safer, less polluted, and quieter cities.
Source: Press Release
In the wake of COP 26 in Glasgow, with the impact of COVID-19 on active travel modes being a reality, and city policies inevitably tending towards cycling development, the topic is more relevant than ever.
A look back at the figures on developments over the last two years in three major French cities: Paris, Bordeaux, and Lyon, as well as two key regions, Bouches-du-Rhône and Nord-Pas-de-Calais. Unique data on major trends in cycling in France.
- Strava Metro records a 45% increase in cycling trips in Paris between 2019 and 2021. This compares to 38% between 2019 and 2020, a figure to be put into perspective with two lockdowns and restrictions that limited travel during 2020.
- Back-to-school resolutions or milder weather? Whatever the reason, September is the most active month in Paris in terms of cycling trips in 2021. The same applies to Lyon, Bouches du Rhône, and Nord Pas de Calais. In Bordeaux, however, June is the most active month.
- 40 minutes and 30 seconds is the average time for a bike trip in Paris. This compares to 38 minutes and 46 seconds in Lyon, 44 minutes and 59 seconds in Bouches du Rhône, 34 minutes and 24 seconds in Bordeaux, or 38 minutes and 16 seconds in Nord Pas de Calais.
- Thanks to cycling trips, in Paris, an average of 46% more CO2 emissions* are saved than in 2019. More than in Lyon (+43%), Bordeaux (+34%), Bouches du Rhône (+35%), or Nord Pas de Calais (23%).
- In Paris, Place de la Bastille, which completed its metamorphosis in early 2021 to benefit active mobility (link) is the most frequented street by cyclists. On this section, Strava Metro records a 143% increase in traffic between January to September 2019 and January to September 2021. It is closely followed by Place de la Concorde (+60% over the same period) where cycle paths were laid out in early 2020 (link). Dating from 2018 and already well-established in use, the cycle path on Voie Georges Pompidou ranks third (+13% over the same period).
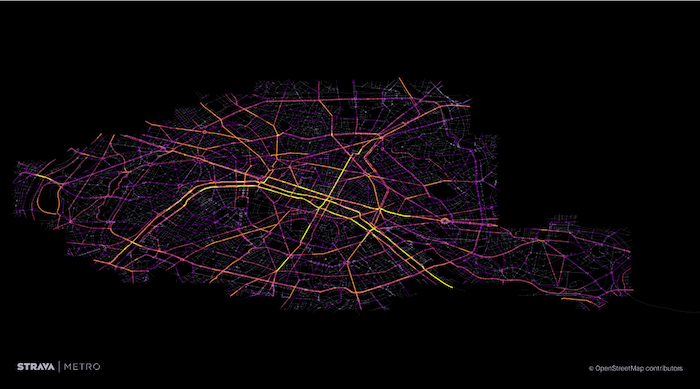
“The Strava Metro heatmap provides an overview of cycling flows in Paris; it’s one of the features we use the most,” explains Benoît Chaumeret, head of the cycling infrastructure mission for the City of Paris. “By quickly visualizing the most used routes by cyclists, we can better understand cycling movements across the Parisian territory. This overview also allows us to better grasp route logic, identify disconnections in flows, and determine the constraints or detours cyclists make to ultimately improve routes and make travel smoother and more natural. Also, since Strava can measure the traffic on a cycle path, it was one of the tools that allowed us to validate part of the Coronapistes network. This traffic data was used to prioritize or not the implementation of new infrastructure.“
“The increase in active travel observed during the pandemic is becoming the new normal in cities worldwide,” says Michael Horvath, Co-founder and CEO of Strava. “It’s a great privilege to be able to share Strava Metro data for free with over 1,500 partner organizations and advocacy groups, to contribute to social equity, infrastructure planning, and improvement. By giving cities this type of data, we support the long-term growth and popularity of active travel.“
See all our articlesNewsShare the post "Cycling trips: + 45% in Paris according to Strava Metro"